User Guide
On the home page, select on the top the type of query to search for polypharmacology or binding mode information. Examples of query can be displayed for the list of kinase inhibitors from PKIDB. Bioactivities and 3D structures and binding mode buttons redirect to Interactive selectivity exploration or Interactive binding mode exploration respectively. Each input text field is case insensitive and suggestion of awaited format is provided.
Bioactivity data search
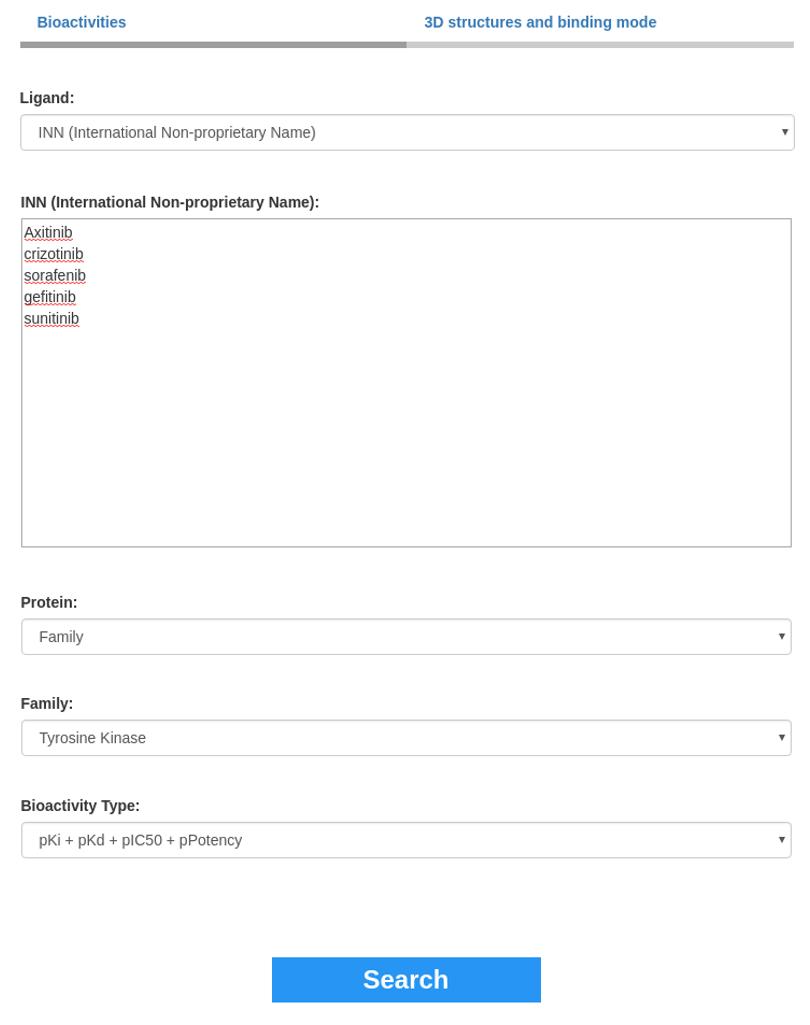
This section is composed of three input fields "Ligand", "Target" and "Bioactivity". Ligand selection is the only field required to search for bioactivity data. Selecting only a ligand list will display bioactivities measured on all the kinome by clicking the Search button. The query can be refined by specifying "Target" or "Bioactivity type" input field.
Ligand selection:
To select ligands and search selectivity in all the kinome, the user can provide:
- SDF file
- Text area for:
- SMILES for searching by:
- Morgan similarity (Maximum number of results: 50)
- Substructure The molecule can be drawn in the JSME molecular editor. Then, the SMILES code is provided from the Get SMILES button. The SMILES code can be pasted in JSME to get the 2D structure of the molecule or converted to drawing using the Draw SMILES button.
Target selection:
The list of targets can be obtained from:
- Lists of:
- Protein names
- Uniprot ID
- Target ID The Target ID is composed of the Uniprot ID concatenated with the information on a mutation by an underscore. (e.g. "P42336_Q546K")
- Family
Bioactivity type selection:
The bioactivity data measured between ligands and kinases can be refined by bioactivity types (e.g. pIC50, pKd, pKi ...). There are two bioactivity groups:
- pIC50, pKi, pKd and Potency (full dose response)
- Inhibition, Activity and Residual Activity (single point)
Interactive selectivity exploration
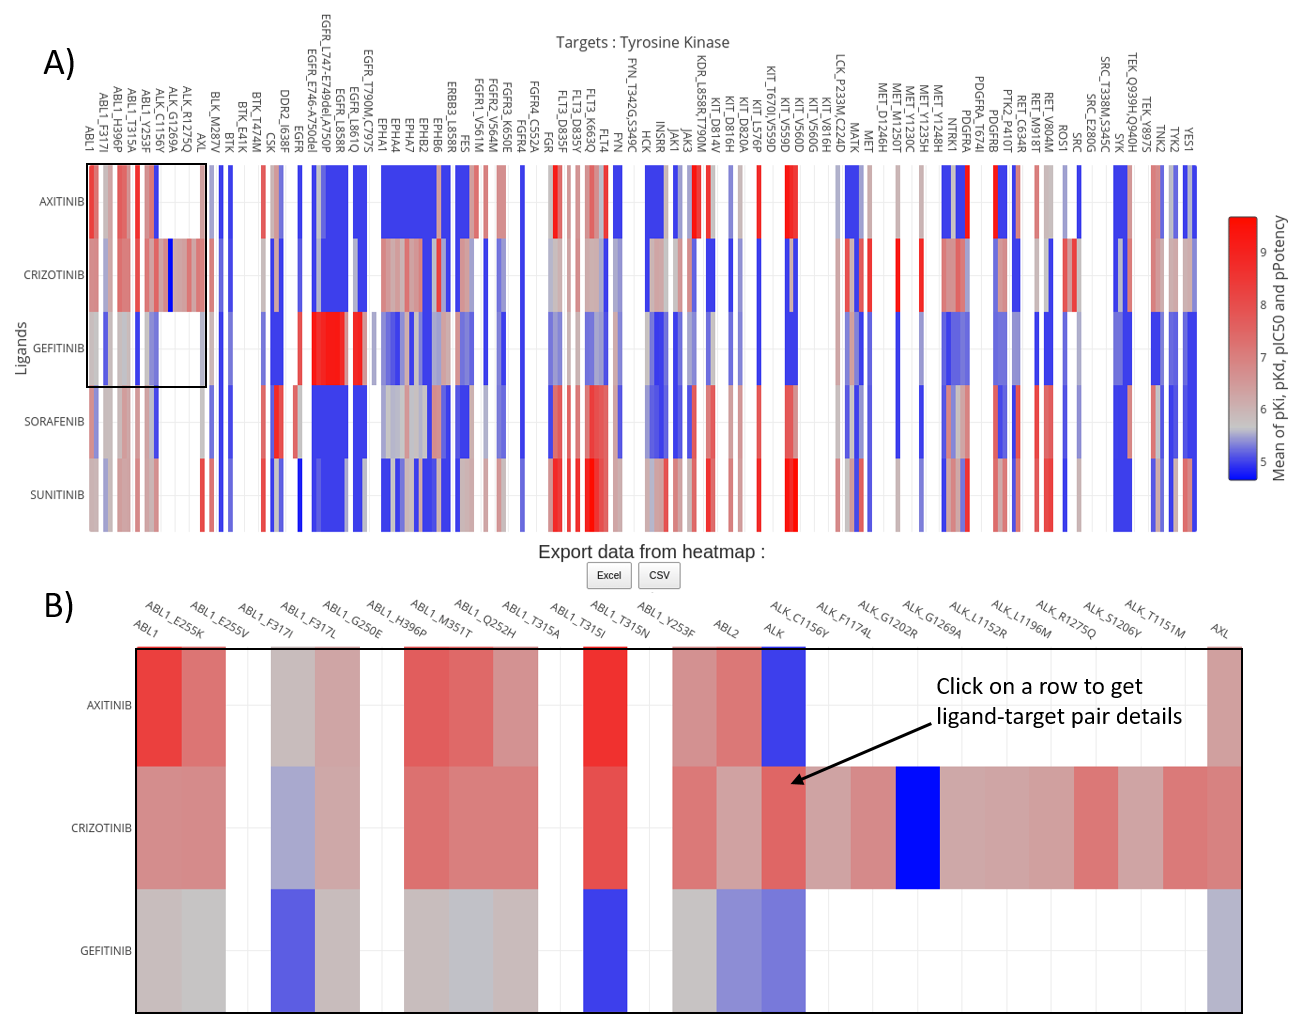
Interactive selectivity exploration is the representation of the selectivity from the previous selection.
Each bioactivity data is extracted from ChEMBL. When several values are available for a ligand-target pair, the mean is displayed.
Borders of the heatmap are the protein-ligand pairs. Inactive and active values are colored in blue and red respectively.
The legend is compressed and does not show all names, the user can zoom on the heatmap by selecting an area.
Control buttons are available on the top right corner of the heatmap. In addition, the heatmap can be saved as picture.
Hovering the heatmap displays the name of the target in the corresponding column, the name of the ligand in the row and the mean of measured bioactivities.
Data from heatmap can be downloaded as .csv or .xlsx to do further studies locally. The distinction between wild-type and mutated proteins is kept in the selectivity panel.
By clicking on one element on the heatmap, it will direct the user to kinase-ligand complex details (sequence interface, 3D structure, bioactivity data).
3D structures and binding mode
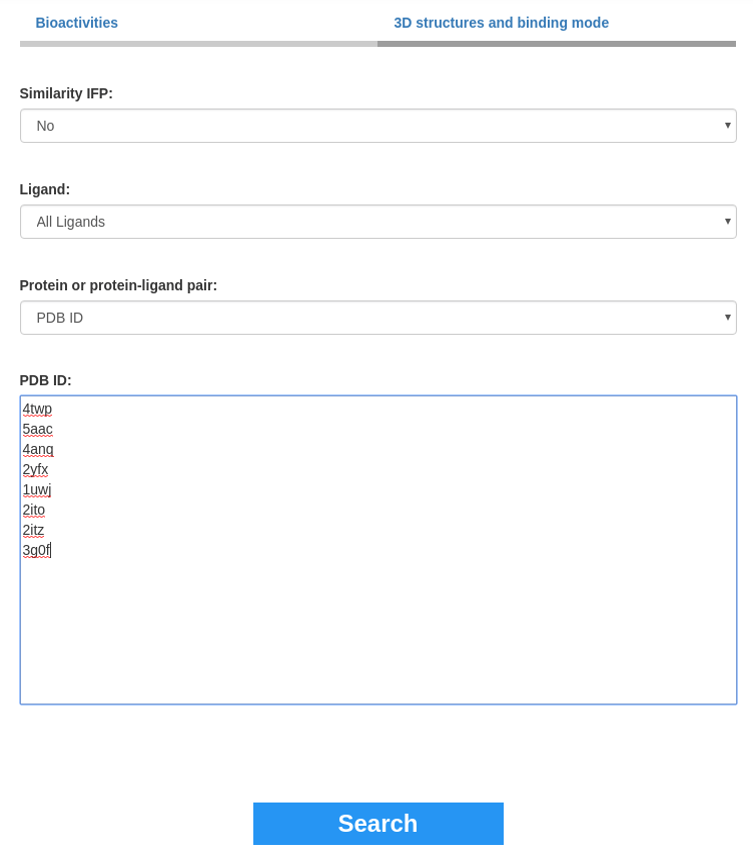
This section is composed of three input fields which all select kinase-ligand pairs. Selecting at least one of the three inputs is required to search for 3D structures and binding modes. The search of kinase-ligands pairs to visualize is launched by clicking the Search button. If several inputs are specified, the list of the common pairs between each selection will be kept.
Similarity IFP:
This field allows or not searching for kinase-ligand interaction similarity. The result will be the list of all pairs interacting in the same way than the input. This search is based on interaction fingerprints (IFP).
Ligand Selection:
To select pairs by picking its ligand, the user can provide:
- SDF file
- Text areas for lists of:
- InchiKey
- PDB, and Ligand ID This ID is composed of the PDB ID concatenated with the chain, the number of ligand and the PDB ligand ID by an underscore. (e.g. "1uwj_B_1_BAX")
- SMILES for searching by:
- Morgan Similarity (Maximum number of results : 50)
- Substructure The molecule can be drawn in the JSME molecular editor. Then, the SMILES code is provided from the Get SMILES button. The SMILES code can be pasted in JSME to get the 2D structure of the molecule or converted to drawing using the Draw SMILES button.
Protein/ Complex Protein-Ligand Selection:
Kinase-ligand pairs can be selected by picking the protein or directly the pair itself:
- Protein:
- Lists of:
- Family
- Protein-ligand complex
- Lists of:
- PDB ID
- PDB and chain ID This ID is composed of the PDB ID concatenated with the chain by an underscore. (e.g. "1ATP_A")
Interactive binding mode exploration
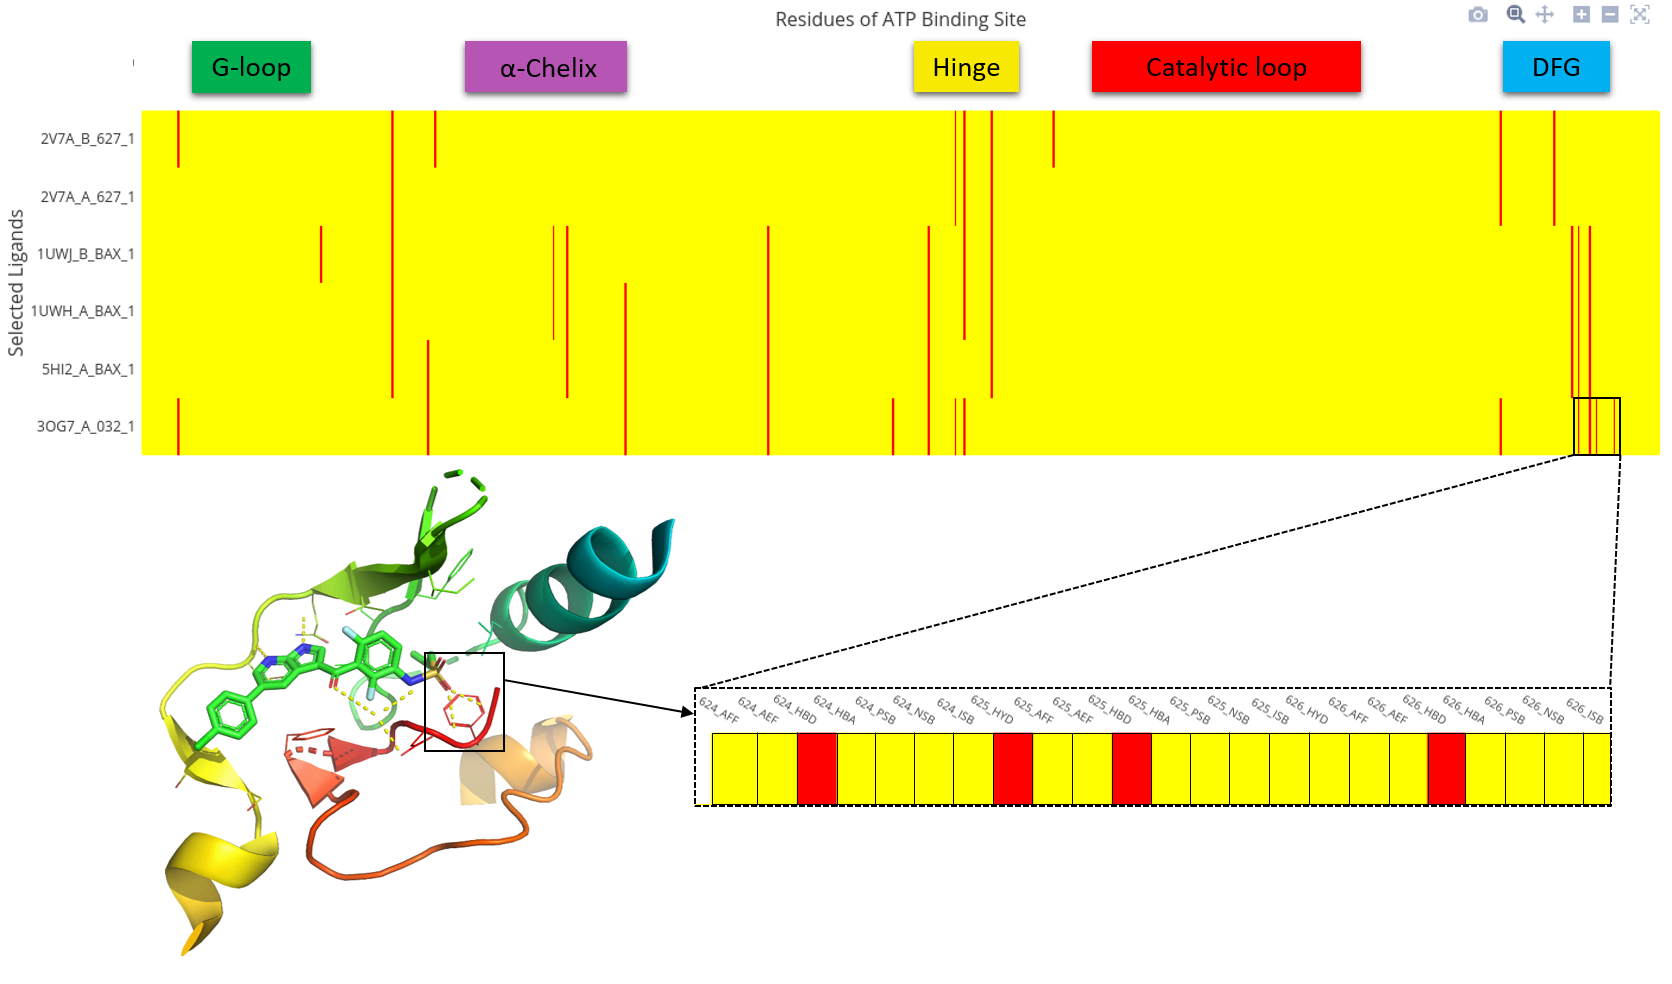
Interactive binding mode exploration is the representation of the non-bounded interactions between ligands and residues in the ATP binding site of the selected protein kinase. Each of the 85 residues is represented by eight types of interactions:
- (Column 0) hydrophobic contacts (HYD)
- (Column 1) aromatic face to face (AFF)
- (Column 2) aromatic edge to face (AEF)
- (Column 3) hydrogen bond with protein as hydrogen bond donor (HBD)
- (Column 4) hydrogen bond with protein as hydrogen bond acceptor (HBA)
- (Column 5) salt bridges with positively charged protein (PSB)
- (Column 6) salt bridges with negatively charged protein (NSB)
- (Column 7) salt bridges having an ionic bond with metal ion (ISB)
Absence of interaction
Presence of interaction
To get all residues the user can zoom on the heatmap by selecting an area. Control buttons are available on the top right corner of the heatmap. In addition to zoom control, the heatmap can be saved as picture. To visualize all information, including bioactivity data on a ligand-target pair, the user can click anywhere on a row of the heatmap.
Data from heatmap can be downloaded as .csv or .xlsx to do further studies locally.
Kinase-ligand complex details
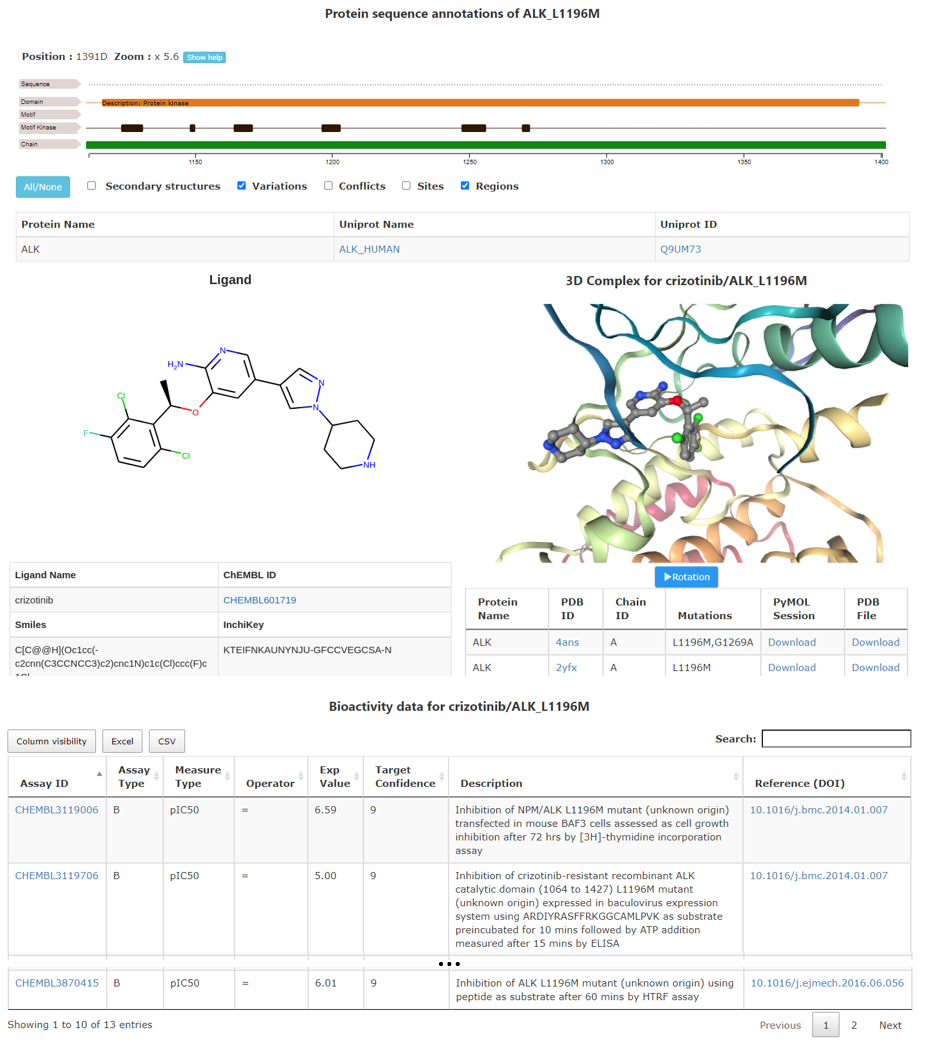
This page provides the complete details on the kinase-ligand selected pair. It uses an URL that is unique for one result, the user can copy it to explore the data again.
The user can obtain information of the protein sequence annotation including natural variants, on the left,
the ligand details with the structure and different identifiers and on the right, a picture from the kinase-ligand 3D complex and several identifiers.
PyMOL and PyMOL Session files including annotations of the structure are provided.
Finally, all the values from ChEMBL for the chosen ligand and protein (keeping information on the mutation) are placed in a table at the bottom of the page.
Data from this table can be saved as xslx or csv files. The table can be sorted on each column. On the top right of the table a search bar is available. Several links allow direct link to the source of information (Uniprot, PDB or ChEMBL).